Bubble Maps Translation site
Bubble Maps visualize the crypto market with interactive bubbles representing different cryptocurrencies, reflecting key metrics like performance and market capitaliza...
Tags:analytics tool blockchain tools bubble chart cryptocurrency data analysisBubble Maps | Bubble Chart for Cryptocurrency - CoinNav
With just a glance at the bubbles, you can uncover connections between holders and gain valuable insights.

Blockchain technology has brought unprecedented transparency, allowing us to delve into transaction details using Block Explorers. On platforms like BscScan, each BSC token has its own page where you can review holdings and transaction history.
However, extracting meaningful insights from raw data on BscScan can be challenging. That's where Bubble Maps comes in, analyzing and rearranging BscScan data to reveal hidden intricacies of tokens that would otherwise go unnoticed.
Bubble Maps Key Rules:
Bubble Maps revolutionizes the analysis of BscScan data by creating visually impactful representations. Each token has its own unique bubble map, offering valuable insights and patterns about holders.
- Each bubble represents a wallet.
- Only the top 150 wallets are displayed.
- Bubble size reflects the proportionate token holdings.
- Bubbles are connected if there were historical transactions between corresponding wallets in BNB.
Your Go-To Source for the Latest News and Tools in the Blockchain Sector - Coinnav.io
Use Case 1: EverRise - Learn the Basics
Explore a selected bubble's information, rank, and holdings. Discover connected bubbles through transaction details.
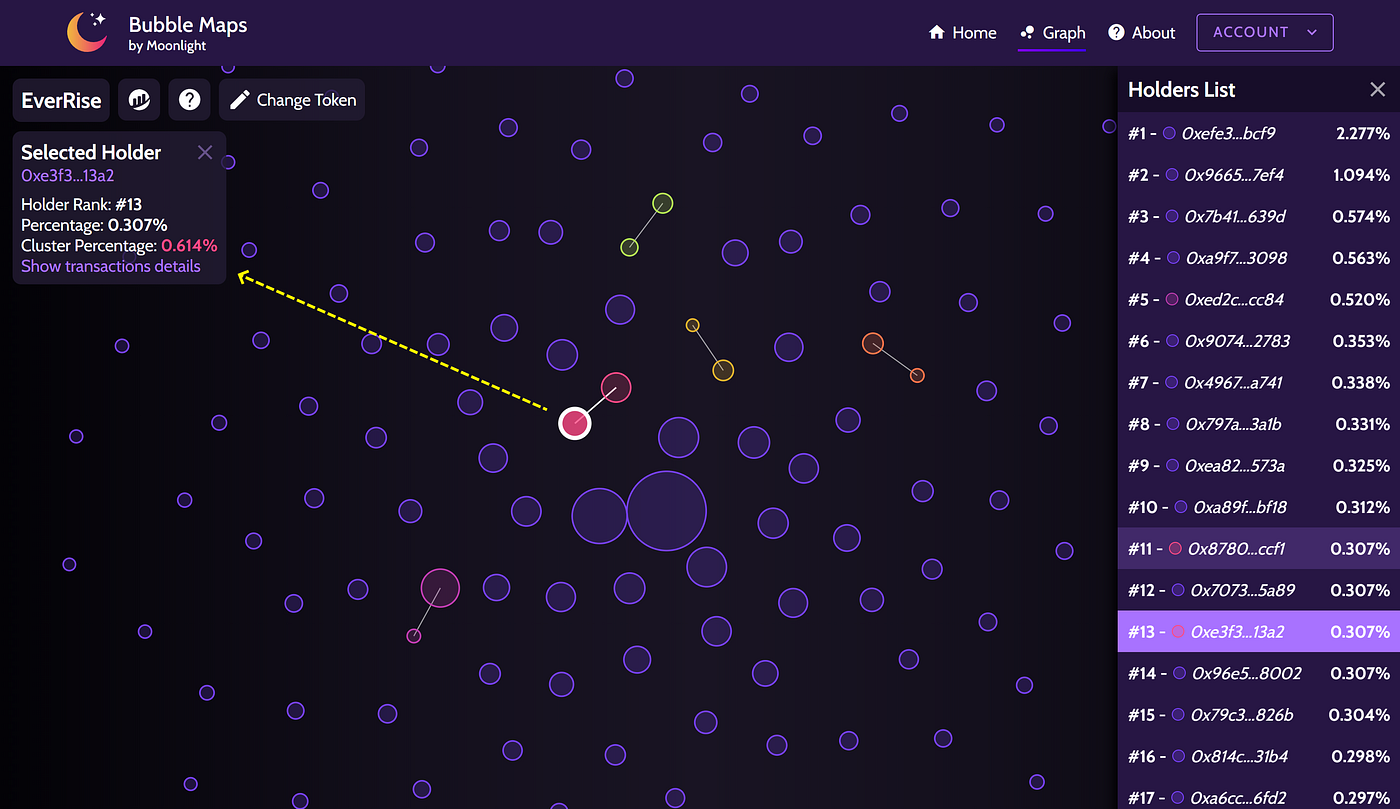
Select a bubble to have its information on the top left panel:
- Selected bubble is ranked #13
- Selected bubble is holding 0.30% of the total supply
- Selected cluster is holding 0.614% of the supply
- Click on “show transactions details” to display all bubbles connected to the selected bubble
Use Case 2: Baby Doge Coin
Connect the Dots Complementing BscScan, the Baby Doge Coin bubble map reveals connections between wallets, highlighting clusters and transaction details.
The bubble map of Baby Doge Coin complements BscScan by adding information about how those holders are connected. Wallets #4, #7 and #9 are forming a cluster, meaning that there were transactions between the wallets.
- There were 2 transactions between wallets #4 and #7
- There were 6 transactions between wallets #4 and #9
- There was no transaction between wallets #7 and #9 (no direct link)
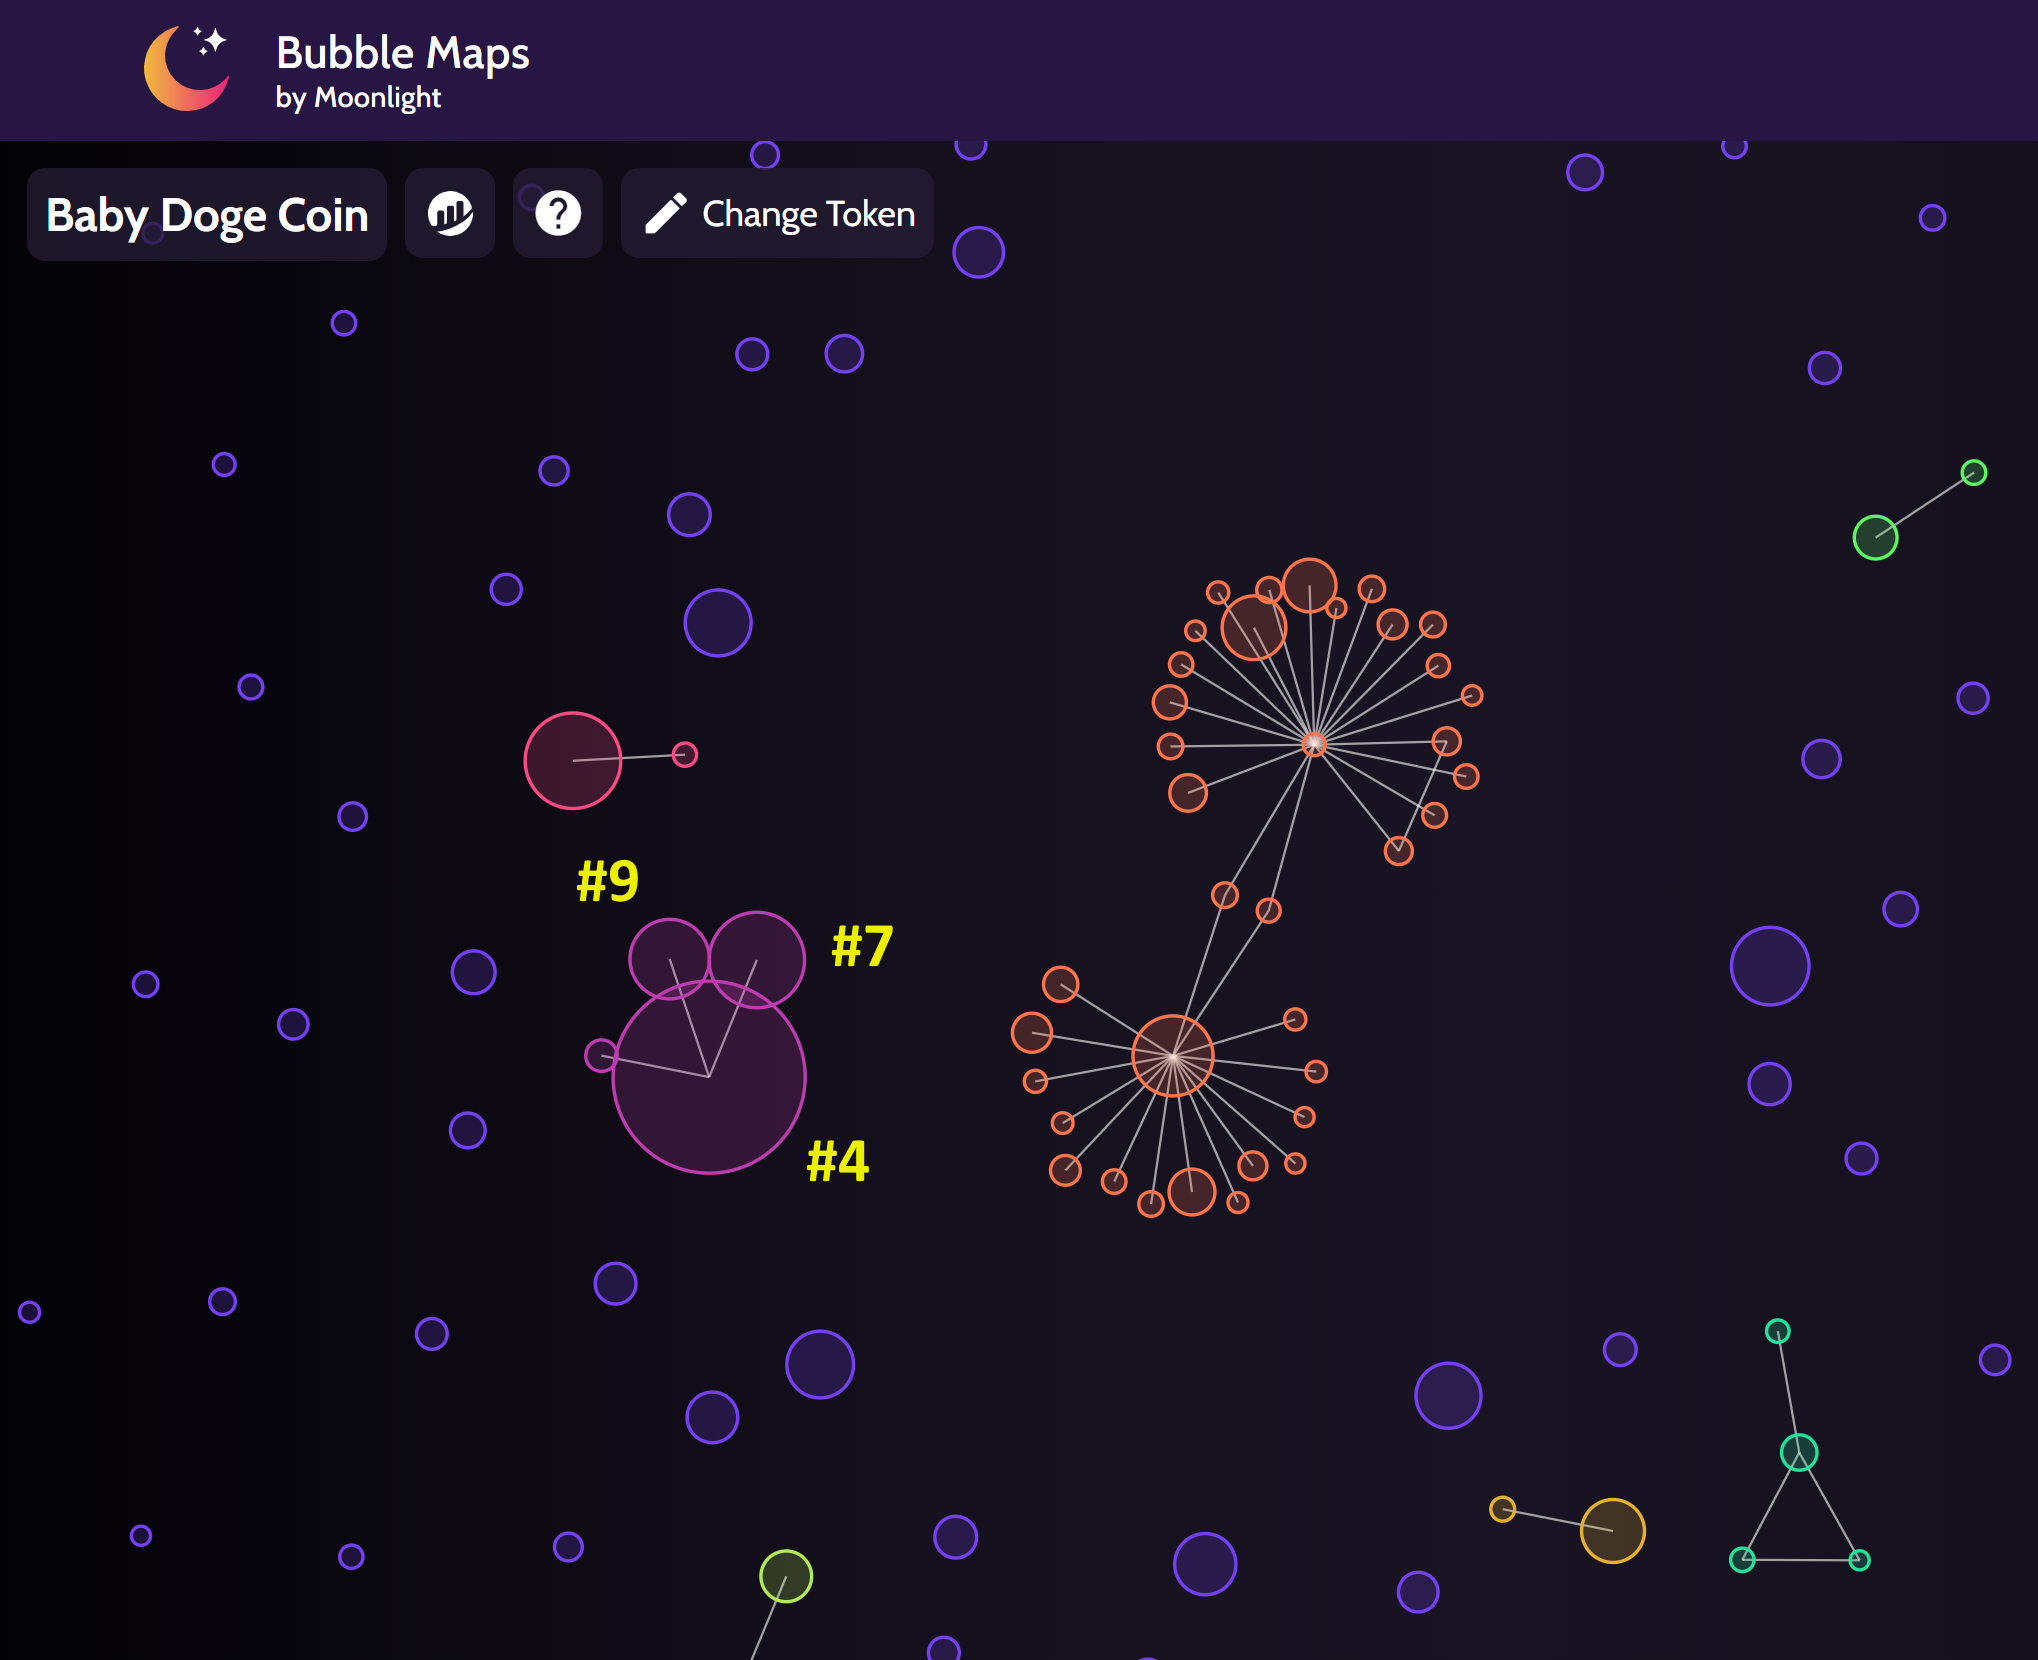

A connection between two bubbles is not “oriented”: transactions could have been from one wallet to the other, or both ways.
Use Case 3: CryptoBlades Token
Investigate Clusters Examine clusters of connected bubbles to understand potential meanings, such as genuine transactions, marketing activities, or investor relationships.
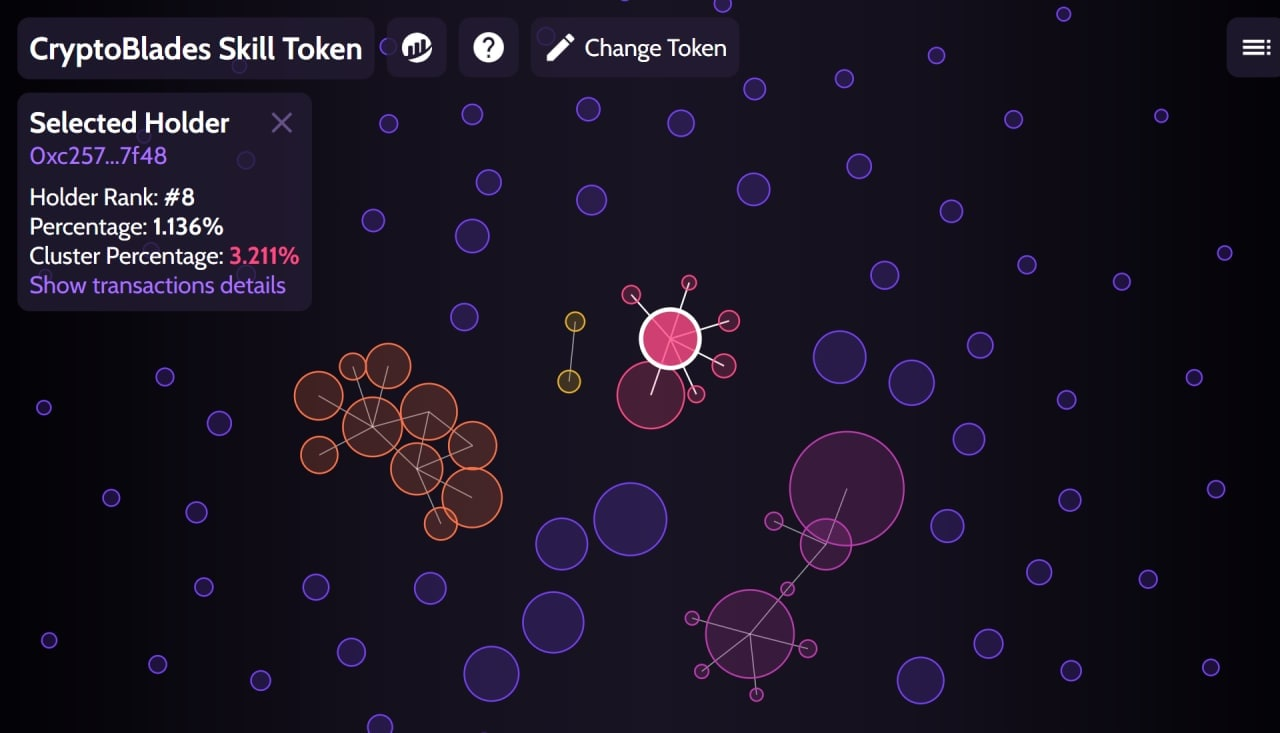
A cluster of connected bubbles (wallets) can have multiple meanings:
- Genuine transactions happened at some point between top wallets
- Marketing wallet have paid other wallets in the top 150
- There was a manual presale
- Wallets belong to the same investor
Other interpretations might apply, make sure to do your own research before investing.
Use Case 4: ShillMoon
Recognize Patterns Analyze patterns in the ShillMoon bubble map, indicating potential manual presales or other significant activities.
ShillMoon is a token on BSC launched in August 22nd. The bubble map of ShillMoon shows that the central bubble (wallet #16) is connected to 60 wallets. This cluster represents 30.9% of the supply. More research has to be conducted to understand the nature of the cluster.
Click on “show transactions details” to see every wallet connected to wallet #16. Most connected bubbles are labeled ‘from’ which means that bubble #16 has been mostly receiving tokens. Further analysis shows that all transactions are between 1 and 5 BNB.
→ This pattern is probably indicating a manual presale.
Use Case 5: Olympus
Recognize Patterns Explore the Olympus cluster to recognize patterns, like marketing wallet behavior, based on transaction details.
Select the bubble at the center of the cluster (wallet #1) and click on “show transaction details”:
- Wallet #1 is connected to multiple smaller bubbles
- Wallet #1 has been sending BNB in small amounts to connected bubbles
- Cluster holds 8.8% of the supply
→ This pattern is probably indicating a marketing wallet.
Use Case 6: Deez Nuts
Recognize Patterns Investigate the Deez Nuts cluster to identify patterns, including significant holdings and large transactions, requiring further investigation.
Select the bubble at the center of the cluster (wallet #34) and click on “show transaction details”:
- Wallet #34 is connected to 17 bubbles with significant holding (size)
- The cluster represent 21% of the supply
- Wallet #34 has been sending 3,000 BNB to connected bubbles in big transactions (700BNB, 900BNB, etc.)
→ Such large amounts have to be investigated.
Access Bubble Maps:
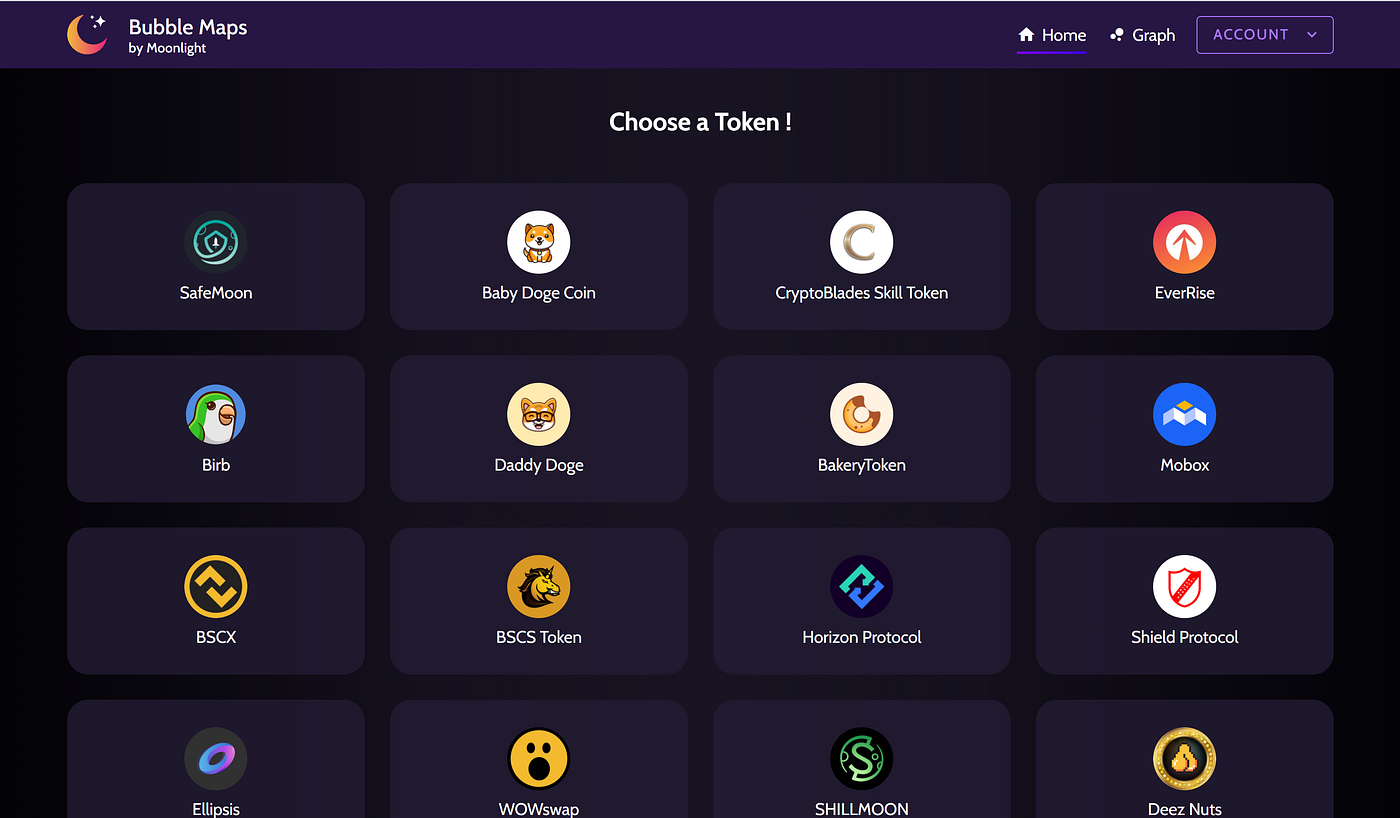
Hold 250 billion Moonlight Tokens to request bubble maps for any BSC token. Preloaded with over 2,000 tokens, Bubble Maps offers insights for tokens available on the Moonlight homepage.
Relevant Navigation